Why Leverage Looks So Attractive
Suppose an investor has $10,000 and borrows $40,000, investing a total of $50,000 in the market.
That creates 5× leverage.
If the investment earns 7%, the gain on $50,000 is $3,500.
After repaying the borrowed $40,000, the investor keeps the profit on their original $10,000 — a much larger return than without leverage.
Of course, losses are magnified as well.
Leveraged ETFs attempt to provide this effect without requiring investors to borrow money themselves.
Examples include:
- ProShares UltraPro QQQ (TQQQ) — 3× long NASDAQ-100
- ProShares UltraPro Short QQQ (SQQQ) — −3× inverse NASDAQ-100
There are also leveraged ETFs tracking the S&P 500.
3× leverage
- ProShares UltraPro S&P 500 (UPRO)
- Direxion Daily S&P 500 Bull 3X Shares (SPXL)
2× leverage
- ProShares Ultra S&P 500 (SSO)
- Direxion Daily S&P 500 Bull 2X Shares (SPUU)
Inverse funds
- ProShares Short S&P 500 (SH) — −1×
- ProShares UltraShort S&P 500 (SDS) — −2×
- ProShares UltraPro Short S&P 500 (SPXU) — −3×
These instruments allow investors to amplify gains — or losses — without directly borrowing money.
The Key Detail Most Investors Miss
Leveraged ETFs are designed to deliver a multiple of the daily return, not the long-term return.
Each day, the fund resets its leverage.
Over multiple days, this leads to compounding effects that can cause returns to deviate significantly from the expected 3× multiple.
This phenomenon is often referred to as volatility decay or path dependency.
Simple Two-Day Examples
To understand how daily leverage works, consider a few simple two-day scenarios.
1. Index rises 1% per day
Index return
1.01 × 1.01 − 1 = 2.01%
Expected 3× return
2.01% × 3 = 6.03%
Actual leveraged return
1.03 × 1.03 − 1 = 6.09%
In this case, the leveraged ETF performs slightly better than exactly 3×.
2. Index falls 1% per day
Index loss
1 − 0.99 × 0.99 = 1.99%
Expected 3× loss
1.99% × 3 = 5.97%
Actual leveraged loss
1 − 0.97 × 0.97 = 5.91%
Again, the result is slightly different from exactly 3×.
When Volatility Becomes a Problem
Real markets rarely move in perfectly consistent directions.
Consider a simple example.
- Day 1: +1%
- Day 2: −1%
Index return
1.01 × 0.99 − 1 = −0.01%
Expected 3× loss
−0.03%
Actual leveraged ETF return
1.03 × 0.97 − 1 = −0.09%
Even though the index almost returns to where it started, the leveraged ETF still loses value.
This happens because daily leverage resets interact with compounding, causing returns to diverge from the expected multiple.
A Simple Sideways Market Example
Consider a simple two-day cycle.
- Day 1: Index +10%
- Day 2: Index −9.09%
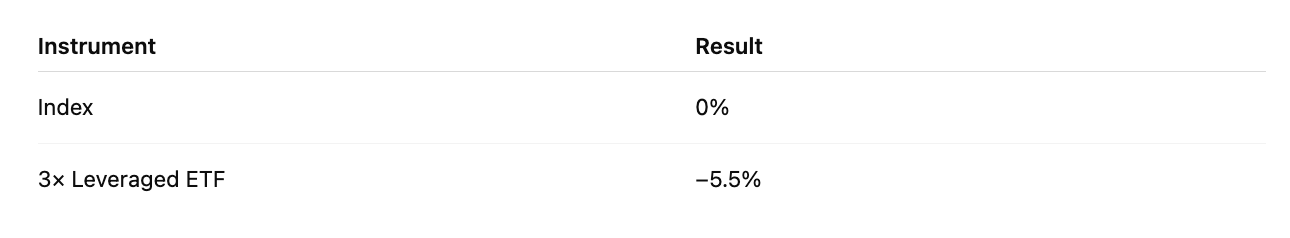
The index returns exactly to where it started.
Index calculation
100 → 110 → 100
Total return: 0%
Now consider a 3× leveraged ETF.
Day 1
- +10% × 3 = +30%
- 100 → 130
Day 2
- −9.09% × 3 = −27.27%
- 130 → 94.5
Even though the index finished unchanged, the leveraged ETF lost 5.5%.
If this pattern repeats many times in a volatile sideways market, leveraged ETFs can gradually lose significant value.
Recovery Can Still Produce Losses
Another example:
- Day 1: −3%
- Day 2: +3.093%
The index fully recovers.
Index calculation
0.97 × 1.03093 − 1 = 0%
Now consider a 3× leveraged ETF.
Day 1
- −3% × 3 = −9%
- 100 → 91
Day 2
- +3.093% × 3 = +9.278%
- 91 → 99.44
Total return:
0.91 × 1.09278 − 1 = −0.56%
Even though the index recovered completely, the leveraged ETF still ends with a loss.
Long-Term Volatility Can Erode Returns
Now imagine a full trading year of 250 trading days.
Scenario 1: Perfectly alternating market
- 125 days +1%
- 125 days −1%
Index result
1.01¹²⁵ × 0.99¹²⁵ − 1 = −1.24%
Expected 3× result
−1.24% × 3 = −3.73%
Actual leveraged ETF result
1.03¹²⁵ × 0.97¹²⁵ − 1 = −10.6%
The leveraged ETF performs much worse than the expected multiple.
Scenario 2: A positive market
- 130 up days
- 120 down days
Index gain
≈ 9%
Expected 3× return
≈ 27%
Actual leveraged ETF return
≈ 20%
Even when the market is positive, leveraged ETFs often fail to reach the expected 3× multiple.
Why Volatility Hurts Leveraged ETFs
Even when the underlying index moves sideways, leveraged ETFs can gradually lose value due to daily leverage resets and compounding. This effect is commonly referred to as volatility decay.
Leveraged ETFs work best in strong, smooth trends.
They perform poorly in volatile sideways markets, where daily resets and compounding gradually erode returns.
Additional Issues With Leveraged ETFs
Several structural factors can further affect performance.
High expense ratios
Leveraged ETFs typically charge around 0.9–1% annually, significantly higher than most broad index ETFs.
Limited dividend capture
Because these funds rely heavily on derivatives and daily rebalancing, dividends often do not fully pass through to investors.
Path dependency
Returns depend heavily on the sequence of daily market moves, not just the final market level.
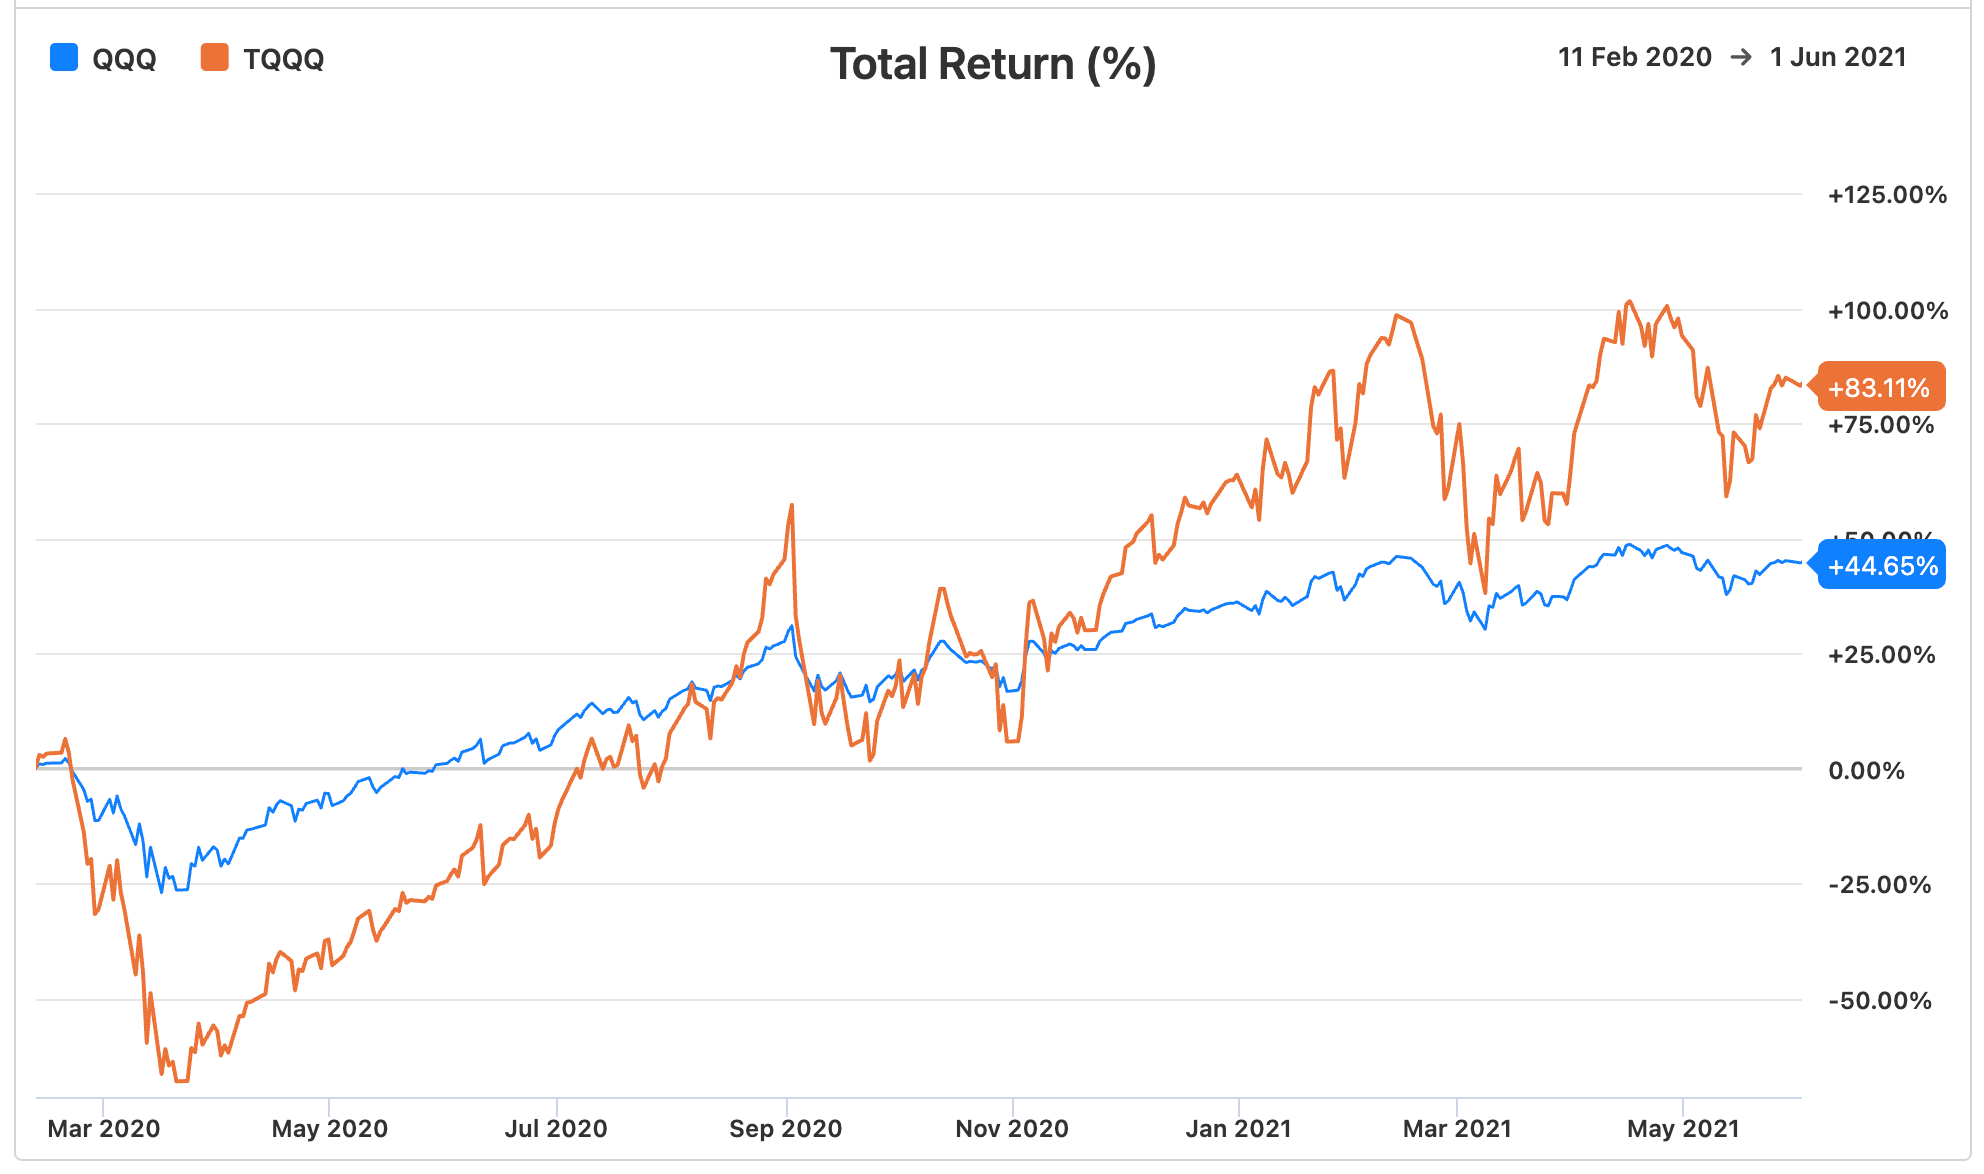
Why Leveraged ETFs Can Still Look Amazing
During strong bull markets, leveraged ETFs can produce extraordinary returns.
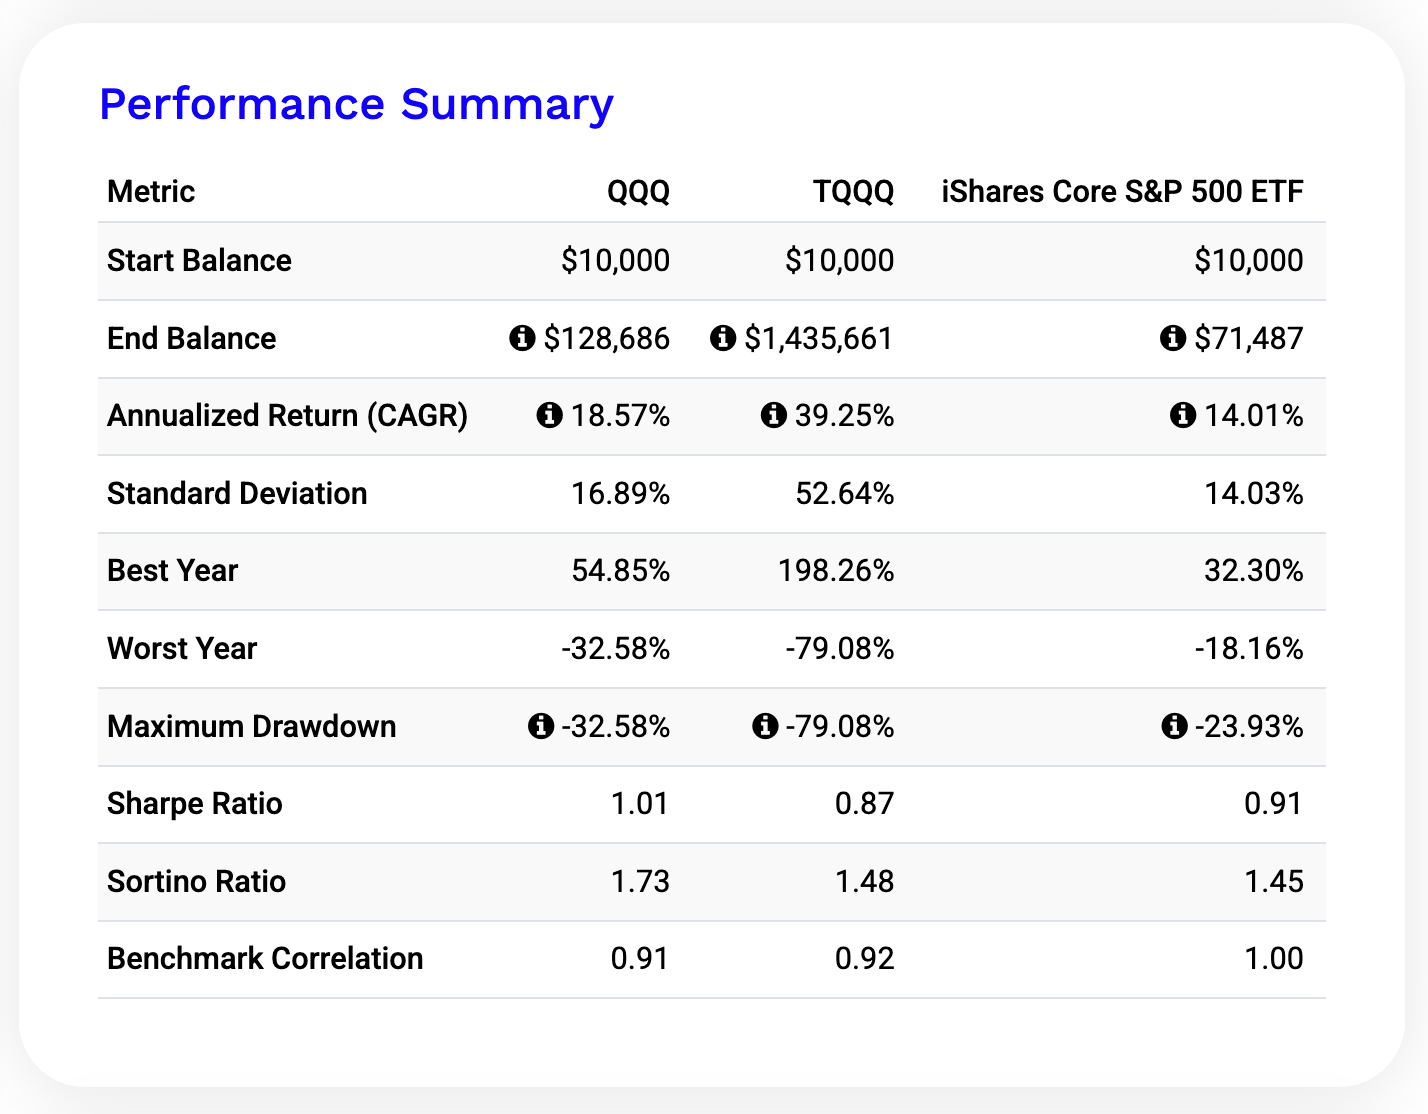
For example, a backtest from 2011 to 2025 using Portfolio Visualizer shows that a $10,000 investment would have grown approximately to:
- S&P 500 (IVV): about $71,000
- QQQ: about $129,000
- TQQQ: roughly $1.4 million
This corresponds to annualized returns of approximately:
- 14% for the S&P 500
- 18.6% for QQQ
- 39% for TQQQ
These numbers can look almost unbelievable.
But they depend heavily on a long, powerful bull market dominated by large technology stocks.
The path to those returns was also extremely volatile.
For example, the maximum drawdown of TQQQ during the period reached −79%.
In volatile or sideways markets, leveraged ETFs can perform dramatically worse.
Risk and Risk-Adjusted Returns
The higher returns of leveraged ETFs come with dramatically higher risk.
In the same backtest:
Maximum drawdown
- QQQ: about −33%
- TQQQ: about −79%
At one point, an investor in TQQQ would have seen their portfolio fall by nearly 80%.
Risk-adjusted performance also deteriorates.
Sharpe Ratio
- QQQ: 1.01
- TQQQ: 0.87
In other words, despite the spectacular headline returns, leveraged ETFs may deliver worse risk-adjusted performance.
The Starting Point Matters
Because leveraged ETFs suffer from volatility drag, the starting point of an investment matters enormously.
Two investors buying the same ETF only a few years apart may experience dramatically different outcomes.
This is another manifestation of path dependency.
The Bottom Line
Leveraged ETFs are trading instruments, not traditional long-term investments.
They can be useful for:
- short-term speculation
- tactical trading
- hedging strategies
But over longer periods, daily leverage resets, volatility, fees, and compounding effects can cause returns to diverge significantly from the expected multiple.
In other words:
3× leverage does not guarantee 3× long-term returns.
Leveraged ETFs amplify not only returns — but also volatility, path dependency, and compounding errors.
In leveraged investing, the path matters just as much as the destination.